Catching up: for background, refer to this post where I lay out what I’m trying to achieve and this post where I share some of my progress on the project to-date.
Downloading and installing the DX_SourceOutliner
You can download the latest build as a ZIP file here. Refer to this post for details on how to install, setup, etc. to use the add-in. As mentioned in prior posts, this is an early-release ‘preview’ of this tool for evaluation and comment and is not intended for production use, USE AT YOUR OWN RISK.
Filtering by Text String is Functional
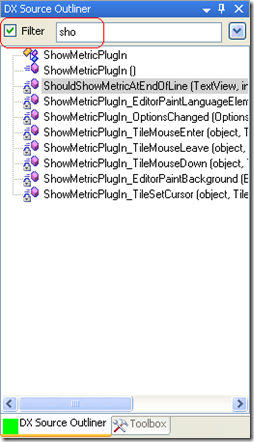
As shown in the following screenshot, toggling the filter ON and typing the beginning of the name of any element into the filter string textbox now properly performs filtering on the elements in the outline…
Caps-Equals-Pascal-Cased-Identifiers-in-Filtering is Functional
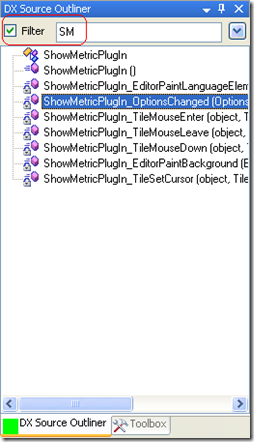
In the following screenshot, you can see that entering the capital letters that match the Pascal-Casing of the elements in the treeview now correctly filters the tree’s nodes by those identifiers that match…
Tooltips Added to Provide Member Visibility and Return Types
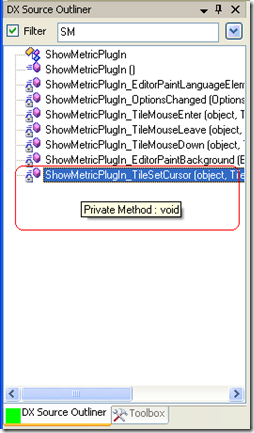
As you may recall from this post, there is already an option to add the return type to the text for each element displayed in the treeview. But sometimes, you want to see the return type for just a single element without having to toggle that display ON for all elements. As shown in the following screenshot, the tooltip for each element now includes both the return type for each element as well as the textual representation of the element’s visibility (in case the funny little icons aren’t 100% informative for you)…
Expand/Collapse Node Doesn’t Select
In the 0.1 ALPHA version clicking a node to expand/collapse it also had the side-effect of selecting the node being expanded/collapsed (oops!) as pointed out by Jorge Alves in this comment. This has now been addressed.
Remaining Issues
The TODO list for the 1.0 release is (more or less) as follows now…
- implement treenode rendering for all the other types (props, structs, enums, etc.)
- investigate the idea of scrolling the code window to place the selected item at the top of the code editor window when the tree node is selected
- consider highlighting the entire line of code in the IDE when an element is selected instead of just firing the ‘beacon’ animation from DXCore (to improve your eye moving to the target in the editor)
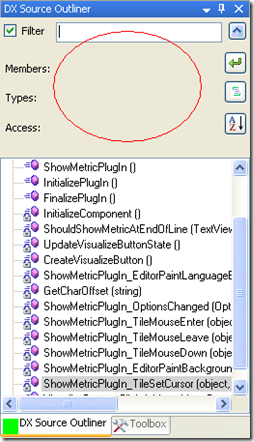
- implement ‘type’ and ‘visibility’ filtering toggle buttons as are presently missing the following screenshot:
With this work remaining, its looking like this will be ready for 1.0 release by sometime this weekend, so keep your eyes peeled for a release candidate pretty soon!


Hello,
Not tested with this release and I don’t know if it’s my environment the problem or the plug-in. I dock the plug-in when I close Visual Studio and start again the “DX Source Code Outliner” is not docked but floating.
Happens on my machine as well. The CodeRush Training window has the same issue.
One
@Kris-I, One:
Am I understanding this properly: you launch VS, open the DX_SourceOutliner window, dock it somewhere, then exit VS.
Upon launching VS again, the DX_SourceOutliner window is still visible, but is now floating instead of docked where you left it? (e.g., the fact that the window is OPEN seems to be retained, but its specific dock state/location isn’t being persisted/reloaded properly?)
I don’t experience this on my end and the ‘responsibility’ for persisting window locations isn’t actually something that either my own code is responsible for — window dock/position/etc. is the responsbility of VS and/or CodeRush, etc.
@One, I know from your tweets that you are running this under the pre-release DXCore/CR/R! 2009.2 release whereas I am running this under the ‘production’ 2009.1 release; could this be the issue (a bug in the 9.2 beta?) @Kris-I, are you also running 9.2 or 9.1?
And if the same behavior happens with the CodeRush training window, I’m going to guess its not something to do with my DX_SourcOutliner code directly…maybe you need to file a bug report with DevExpress re: the 9.2 beta…?
I’m experiencing this with coderush training window and the documentor plugin as well, so this must be a bug in coderush/refactor pro!.
@Valdimar:
The 9.1.x ‘official release’ or the 9.2.x preview release (or both?)
I’m using 9.1.5
@Valdimar:
I’d suggest submitting a bug report to DevExpress then — they should know about it to fix it before the release of 9.2 (soon).
I use DX Core 9.1.4
@Kris-I + Valdimar:
That certainly sounds a lot like a bug of some kind that you guys should report to DevExpress then since you’re experiencing it in the released 9.1.x version.
I’ve tried it on my home computer and it seems to work there, so I’m gonna have to explore this further.
According to Devexpress this issue was fixed a while ago.
http://www.devexpress.com/Support/Center/p/B92003.aspx?searchtext=docking+window&p=T4|P6|0
I’ll be da ….
Been seeing this behavior for days, and now I can’t reproduce the problem.
Oh well, your post must have fixed it. Damn, you are good ! 🙂
One
P.S btw, running W7 7100
All:
FWIW, IIRC I had this behavior ONCE during the development cycles of this app (I have lots of chances for it to happen, since everytime I spawn the debugger it has to launch and then close a whole other copy of Visual Studio).
My guess is that its based on some obscure complex combination of events that all has to be true/in perfect alignment to happen reliably. Probably, that set of conditions is hard to duplicate so the bug report logged in the DevExpress forum *seemed* to them to be 100% fixed yet it sounds as if its more like 99.9% fixed 🙂